
Bitcoin (BTC) made further gains on Tuesday, with the market selling around $71,000 after bouncing off a big technical level last week. BTC’s technical indicators indicate a bullish trend, and analysts claim that the coin will hit a new all-time high of $78,900 soon.

Rising institutional interest, specifically through ETFs, which pulled in over $472 million on Monday, extending last week’s momentum, encourages this positive outlook. The long-to-short ratio for BTC also seems to have reached its highest level this month, while Bitcoin futures Open Interest reached a record $42.23 billion.
Why does Institutional Interest in Bitcoin Remains Unshaken?
The steady flows of Bitcoin to institutional investors on U.S. spot Exchange Traded Funds (ETFs)Keep Bitcoin Demand Over Time, Data from Coinglass Reveals. It could further push the ongoing BTC price surge if this trend holds

Nearing the end of the year, CryptoQuant says that one bullish phase of Bitcoin could be on the cards because the percentage of Bitcoin held by U.S. entities, i.e., exchanges, banks, and funds, is on the move.
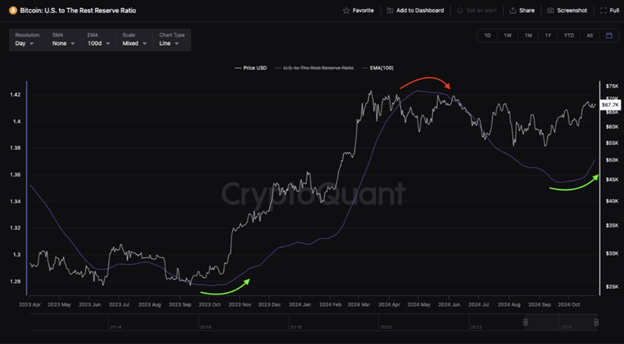
If the patterns have been repeated historically, similar increases in U.S.-held BTC often presaged a notable bull run in late 2023, suggesting that BTC could similarly be headed for another upward move.
Analyzing On-Chain Metrics
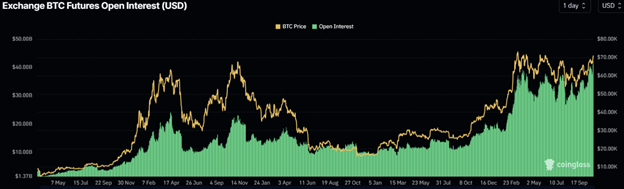
This optimism is reinforced by on-chain data, as Coinglass reported a new all-time high in Futures Open Interest at $42.23bn on Tuesday. This spike signals new capital inflows and buying activity, leading to current Bitcoin momentum.
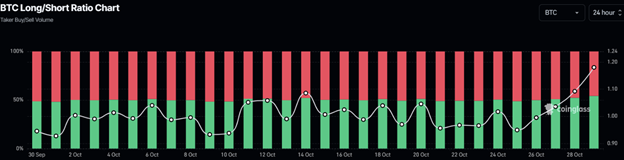
Bitcoin’s long-to-short ratio has skyrocketed to 1.18, the most significant level in a month. The above figure signaled a bullish outlook since a figure above one means more traders expect BTC’s price to rise.
Bitcoin Price Analysis
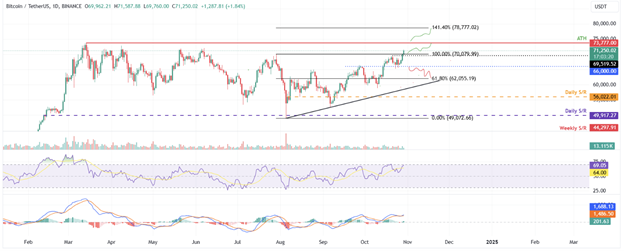
Bitcoin recently broke outside of a downward-sloping parallel channel on the weekly chart, which it tested at $67,500 retesting this week. Early this week, the leading cryptocurrency by market cap surpassed 4.5% to trade at around $71,000.
There are some technical projections for the pattern, which point to an all-time high target of $78,955, created by utilizing the distance between the trendlines of the channel and extending higher.
The weekly chart shows that the Relative Strength Index (RSI) continues to show strengthening momentum: it stands at 60, is overbought but above neutral 50, and is above oversold 30.
Despite some negative signs on the daily chart, Bitcoin also looks bullish, as it still managed to rebound 4.89% to $69,886 on Friday and even touched support around $66,000 on Monday. When it comes to BTC, these gains have carried on for the sake of Tuesday.

Bitcoin continues to rally, and it may try to break above the next significant resistance, which is near $73,777, the top hit in mid-March. If BTC can squeeze past this top, a successful close may put it in an excellent position to move towards the 141.40% Fibonacci extension level from July’s high of $70,079 to August’s low of $49,072, near $78,777, which is the target on the weekly chart.
On the Bitcoin daily chart, the Relative Strength Index (RSI) stands at 69.90, at the overbought region of 70, and thus indicates bullish solid momentum. Let’s assume that the RSI is crossing into the overbought zone.
At that point, investors might be hesitant to add to their long positions, as this usually indicates a market due to pullback. On the other hand, the rally could continue up as the RSI still stays in overbought territory, riding the bullish trend.
If Bitcoin can set up a close below $66,000, it can drop another 5.8% and retest its next support at $62,055, the 61.8% Fibonacci retracement level of July’s high of $70,079 to August’s low of $49,072.
Solana (SOL) Price Rises for Fourth Consecutive Day, Reaches Near Three-Month High Over $180
Solana (SOL) has been on a four-day winning streak, pushing to a new high above $180 on Tuesday, its highest level in nearly three months. The rally comes as the Solana network is experiencing a surge in active addresses—a sign that traders are now enticed to the blockchain and that SOL has a bright future ahead.
The volume of active addresses in Solana’s blockchain is growing steadily, increasing demand for its services. Active addresses are the number of unique wallet addresses active as receivers or senders of assets on the network and convey broader activity trends.
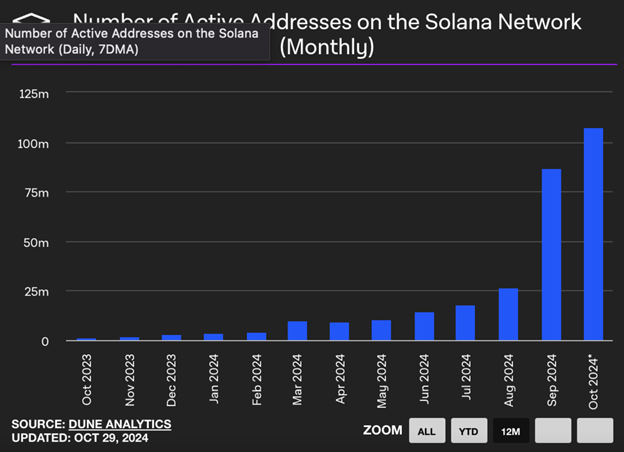
New data from The Block shows an upward trend in active addresses on Solana, particularly in the past few months. While not final by two days to the end of the month, October data has the metric inching up toward 107.04 million. Since data is finalized, this figure will give us a better sense of Solana’s recent growth.
As of Sunday, Dune Analytics data captures a daily count of approximately 2.68 million total active addresses, down from the peak of 8.81 million on October 22 on a daily scale. Activity on Solana-based decentralized exchanges and meme coin trading is likely why this spike started so strong.
Solana Price Prediction: SOL May Reclaim March Highs
Solana’s uptrend has been steadily on the rise since early October. As of Tuesday, the token had been testing a big resistance area around $180. A daily close over this psychological barrier could put SOL on the path to its 2024 high of $210.18, which last was seen on March 18.
Such a peak would represent a 16 percent rise from the present price. Nevertheless, there is an area of resistance within a Fair Value Gap (FVG) of $192.24- $193.69 that can tempt SOL on its way to this target.
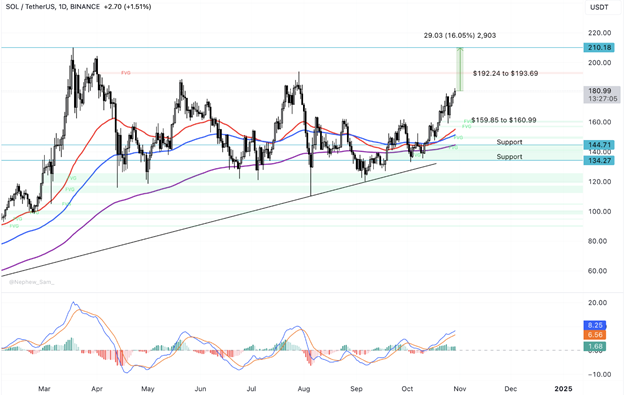
According to the technical indicators, SOL has positive momentum. If SOL’s price is moving up, the neutral line is lined with green histogram bars on the Moving Average Convergence Divergence (MACD) indicator, indicating bullish sentiment.
On the other hand, the Relative Strength Index (RSI) on the daily chart is at 68, close to the overbought range. A level above 70 might indicate a marked increase in a corrective pullback in the near term.
The daily price chart shows that as Solana goes down, the altcoin may target liquidity within Fair Value Gap (FVG) between $159.85 and $160.99. Then there are the additional key support levels identified from the Exponential Moving Averages (EMAs) and the upper and lower boundaries of imbalance zones at $144.71 and $134.27.
ETH Rally on the Horizon?
On Monday, Ethereum (ETH) took back the important $2,500 level after it rallied roughly 1% against exchange withdrawals, which sent investor sentiment bullish. But while Ethereum’s ETF flows underscore potential roadblocks to price growth, on-chain data indicates optimism.
Data from CryptoQuant shows that Ethereum investors have taken around 300,000 ETH (around $760 million) off exchanges in the past week.
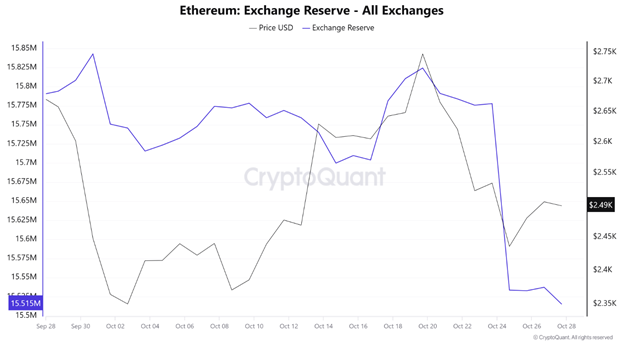
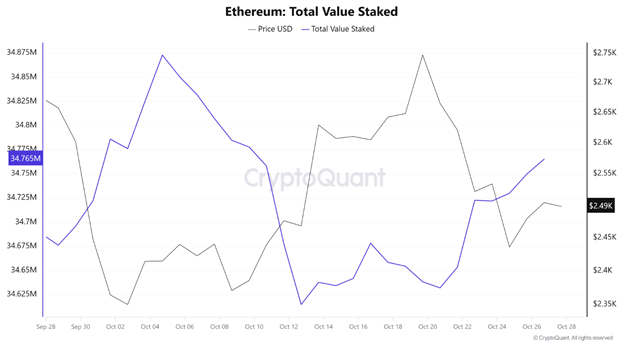
If this trend is anything to go by, many investors must have taken advantage of last week’s price dip as a strategic buying opportunity. It seems that a significant percentage of the withdrawn ETH found itself in staking protocols, as the amount of ETH staked rose by some 130,000 during that time.
However, this on-chain bullishness does not align with that of traditional investors. The $35 million last outflow from Ethereum ETFs on CoinShares was the largest outflow of digital asset ETFs in 2021.
That is significantly different from Bitcoin and Solana ETFs, which saw net inflows of $920 million and $10.8 million, respectively, evidencing greater confidence with traditional investors in those assets.
Separately, Hong Kong Monetary Authority Stablecoin Issuer Sandbox member RD InnoTech is said to be readying to launch a Hong Kong Dong Stablecoin (HKDR) on the Ethereum network via Wu Blockchain.
Ethereum Price Analysis
At press time, Ethereum is down 0.6% in a 24-hour period and has suffered $13.51 million in liquidations. Long liquidations come to $4.34 million, and short liquidations to $9.17 million.
ETH is consolidating within a critical rectangular range, with resistance at $2,594 and support at $2,395. In addition, the asset is currently in action to break above the convergence of its 200-day, 100-day, and 50-day Simple Moving Averages (SMA).

Ethereum may convert the $2,594 resistance into support should it successfully break these SMAs. At the current reading of the Relative Strength Index (RSI), investors are still very much in the middle, which means they are apathetically neutral. A close below $2,395 daily candlestick permanently invalidates this outlook.


